How Safe Is South Korea?
Robbery
How Safe Is South Korea?
Is South Korea Safe?
Robbery
Before presenting the specific numbers,
let’s clarify the terminology first.
Also, because countries classify crimes somewhat differently,
I want to point out in advance that there may be some margin of error when comparing crime statistics between countries.
I chose 2023 in an effort to use data from the same year as much as possible.
Even so, there are some figures for which I could not find data from exactly the same year, resulting in differences of around one year.
However, I did not use data from the height of the COVID-19 pandemic,
when there were unusually large variables affecting crime patterns.
South Korea
First, let’s look at the difference between robbery and theft,
as there may be some confusion between the two.
Robbery
is a crime in which a person takes another person’s property by using violence or threats.
Theft
refers to taking another person’s property without using violence or threats.
If violence or threats are used in the course of committing a theft, such as to take or steal property, the offense may constitute robbery.
I plan to cover theft separately,
but I’ll give just one example to make the distinction between theft and robbery clear.
Suppose someone breaks into a house believing that it is empty in order to steal something.
While stealing, the burglar encounters the homeowner,
who has woken up because of a strange noise.
At that point, you can’t exactly say:
“Don’t move.
If you move, I’ll…”
Haha, nice to meet you.
I’m just going to take some of your jewelry.
And if you have any cash, please hand that over too.
What kind of house doesn’t have any cash?
All you’ve got is a transit card. Haha.
You can’t do that, right?
If you say,
“Don’t move, or I’ll kill you,”
and continue the theft,
from that moment, it becomes robbery.
Then what if you say:
“Don’t move.
I’m leaving right now, so don’t follow me.”
And then run away?
Even in that situation, you may be punished as a robber under the rules concerning quasi-robbery.
So what should you do?
You have to run away immediately without making any threats.
That way, you can avoid turning the theft into a robbery.
You didn’t threaten the homeowner.
You didn’t assault them.
You didn’t suppress their ability to resist.
You simply ran away.
That’s theft.
Simply encountering the homeowner does not automatically turn a theft into a robbery.
But why am I explaining all of this?
Let’s keep going.
What we’re going to look at this time is
residential burglary involving the intrusion into a residence or building to steal property.
I chose to focus on robbery involving intrusion into a residence
because I considered crimes occurring inside a residence to be more directly related to an individual’s personal safety.
The title of this article is:
Is South Korea Safe?
And residential robbery is also suitable for this discussion
because, as a single category, it accounts for the highest proportion.
| Year | Total Robberies Nationwide | Actual Number of Residential Robberies | Residential Robbery Rate |
|---|---|---|---|
| 2023 | 599 cases | 169 cases | 28.2% |
| 2022 | 532 cases | 197 cases | 37.0% |
| 2021 | 511 cases | 229 cases | 44.8% |
| 2020 | 692 cases | 240 cases | 34.7% |
KICJ — Crime Trends and Criminal Justice Policy in Korea 2024
For comparison, the figure we will use for 2023 is 169 residential robbery cases, accounting for 28.2% of all robberies.
The report was published in 2024, and the data it covers are from 2023. (KICJ)
169 cases.
If there were only 169 residential robbery cases in an entire year across private residences, offices, stores, and other locations, I would consider that a very safe country.
Let’s compare it with the United States.
You might say:
“If you’re going to compare countries, shouldn’t you compare South Korea with neighboring Japan or China?
Why compare it with the United States, where guns are so common?
Are you trying to show that the number is lower than in the United States and then say,
‘See? South Korea is safe’?”
You could certainly make that argument.
But even without the United States, I believe that 169 cases per year is already a sufficiently small number to demonstrate a high level of safety without needing a comparison country.
It’s not that I didn’t look for data from Japan or China.
In Japan, the figure is lower than South Korea’s, or the difference is so small that Japan can reasonably be described as being in a similar range.
As for China, I eventually gave up trying to find a reliable figure.
Perhaps because of differences in political systems, some datasets include crimes committed by corrupt government officials, making it difficult to find figures with those cases excluded.
In other cases, even the percentage itself is not publicly available.
And when comparing a population of more than 1.3 billion with a population of just over 300 million, the presence of firearms can certainly be a major variable.
But it cannot explain everything.
The cases of Finland and Norway can provide an answer to that question.
FBI Crime Classification: Robbery, Burglary, Theft, and Other Property Crimes
In U.S. crime statistics, property-related offenses are classified somewhat differently.
Broadly speaking:
Robbery
→ Taking or attempting to take something of value from a person by using force, the threat of force or violence, or by putting the victim in fear.
This is broadly comparable to robbery in South Korea. (Federal Bureau of Investigation)
Burglary
→ Unlawfully entering a structure with the intent to commit a felony or theft. Attempted forcible entry is also included.
It can be considered the U.S. category most similar to residential or premises-based theft involving unlawful entry in South Korea, although the legal definitions are not identical. (Federal Bureau of Investigation)
Theft / Larceny-Theft
→ The unlawful taking, carrying, leading, or riding away of another person’s property without force or violence.
This is broadly comparable to theft in South Korea. (Federal Bureau of Investigation)
Burglary is classified by the FBI as a Property Crime, together with Larceny-Theft, Motor Vehicle Theft, and Arson. (Federal Bureau of Investigation)
Four Property Crime Categories
Burglary — 침입절도
Larceny-Theft — 절도
Motor Vehicle Theft — 자동차 절도
Arson — 방화
When I discuss theft later, I will explain this in more detail, but there is one point worth noting here.
The FBI includes Arson in the Property Crime category, but arson is handled somewhat differently when specific property-crime totals are calculated.
The reason is that arson involves the destruction of property, rather than simply taking property. The FBI therefore classifies it as a property crime, but notes that arson data have historically been subject to different collection procedures and limited data availability. Arson is not included in the estimated property-crime volume figures in the traditional UCR system. (Federal Bureau of Investigation)
South Korean Robbery vs. U.S. Robbery
South Korea — 2023 Robbery Cases: Reference Figure
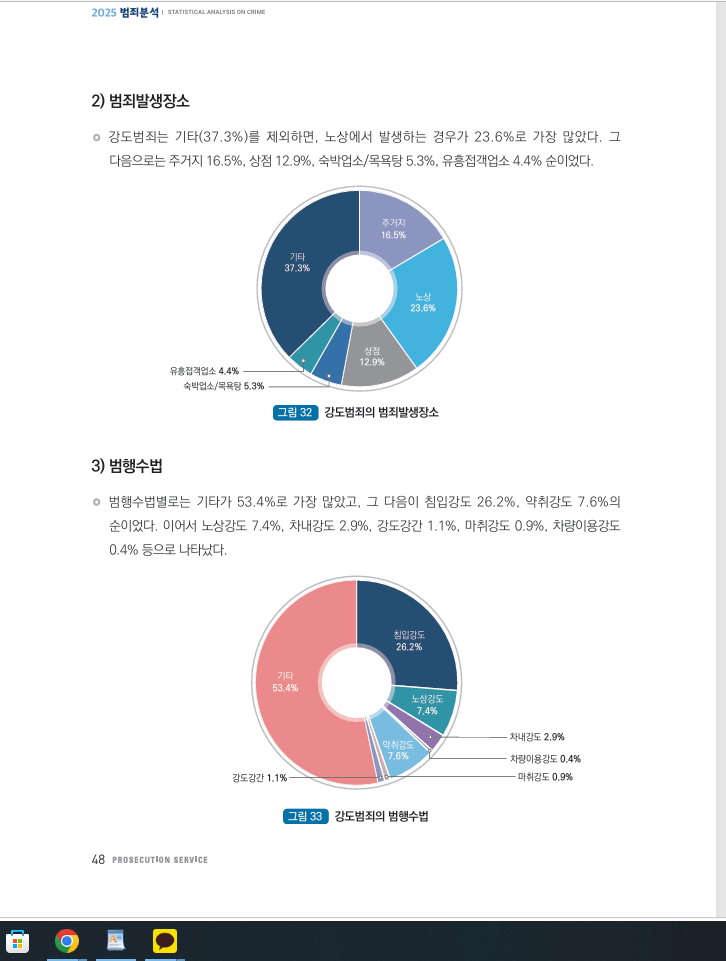
You can see the 28.2% figure again in the second table.
As mentioned earlier, this figure includes residences, offices, stores, and other locations.
And in the first table, the proportion of robberies occurring in residential locations is 16.5%.
This is simply a classification based on the location where the crime occurred.
So:
599 × 16.5% = 98.835 cases
For now, we can obtain a figure of approximately 98 cases through this simple classification.
This does not mean that the classification itself is incorrect.
However, what I wanted to find was the proportion of residential locations specifically within residential-intrusion robberies.
Here is the source I found.
According to the research report by the Korean Institute of Criminology and Justice (formerly the Korean Institute of Criminology) titled “A Study on the Selection of Targets by Robbery and Theft Offenders,” …
| Crime Location | Residential Robbery | Residential Burglary |
|---|---|---|
| Private Residence | 65.4% | 54.5% |
| Private Store | 8.1% | 10.9% |
| Entertainment & Leisure Establishment | 17.6% | 17.8% |
| Medium & Large Business | 5.1% | 9.9% |
| Public Institution | 2.2% | 4.0% |
| Other Locations | 1.5% | 3.0% |
| Total | 99.9%* | 100.1%* |
It says so.
Although the sample is relatively small, with 136 residential-robbery offenders and 101 burglary offenders, considering that residential structures are broadly similar in terms of their basic form, I think it is reasonable to use this as a reference.
Let’s just say that’s roughly the case.
Now let’s apply the numbers.
Starting with the 169 residential robbery cases we obtained earlier, if we apply the 65.4% figure above:
169 × 65.4% = 110.526
We can therefore use 110 cases as a reference figure.
That’s enough.
We found the higher figure, so we’ll use this number for the comparison.
The nationwide figure is now established.
Next, let’s calculate the figure for Seoul, South Korea’s largest city, and then make a simple comparison with a U.S. state and the largest city in that state.
Seoul City Council publishes robbery and theft figures transparently in its statistical data.
Robbery — Seoul —
| Year | Total Robberies in Seoul | Residential Robbery Rate | Estimated Residential Robberies | Private Residence 65.4% | Estimated Residential Robberies at Private Residences |
|---|---|---|---|---|---|
| 2023 | 129 cases | 28.2% | 36.38 cases | 65.4% | 23.79 cases ≈ 24 cases |
| 2024 | 87 cases | 24.7% | 21.49 cases | 65.4% | 14.05 cases ≈ 14 cases |
The residential robbery rate is the same figure used for the nationwide data.
For the second calculation, I used the classification method that produced the higher figure.
2023
A crime in which someone unlawfully enters a residence and takes another person’s property by using force or threats.
It is already safe.
In fact, there is no need for a comparison.
If we really wanted to make a meaningful comparison, I think it would make more sense to compare South Korea with a safe country such as Finland or another Nordic country, where citizens can legally purchase firearms if they meet the eligibility requirements.
Even so, South Korea has fewer robberies than the Nordic countries.
The Nordic countries, in particular, have an enormous number of vacation homes, which contributes to a substantial number of residential burglaries.
And if you encounter the offender during a burglary, that is when the real problem begins.
Let’s continue.
My original intention was to compare New York State and New York City.
It was simply this:
“Hmm? New York is the most populous and prominent city in the state,
and Seoul is by far South Korea’s largest city,
so Seoul would be a good city to compare it with.”
That was the idea.
But when the crime figures turned out to be somewhat higher than I expected, I added two more states.
I didn’t want to deliberately choose a country with a high crime rate and then say,
“Look how safe we are.”
There was no need to do that.
This time, I asked GPT to suggest U.S. states with environments comparable to South Korea and Seoul.
It recommended California and Los Angeles.
After seeing the numbers, I immediately asked GPT another question:
“Then tell me which state is the safest.”
And that’s how Maine and Portland ended up being added somewhat artificially to the comparison.
After that, I added Japan.
Japan is essentially included to confirm that there was no major problem with the calculation method I used.
I already knew there wouldn’t be much to find.
And sure enough, when I ran the numbers, Japan actually came out lower than South Korea.
So first, let’s look at the broad comparison:
the number of cases per 100,000 people.
I referred to the FBI’s official published data.
Official FBI Data — UCR Summary of Reported Crimes in the Nation, 2024 (cde.ucr.cjis.gov)
Robbery
Street/highway: 75,329
Miscellaneous: 46,321
Residence: 35,575
Commercial house: 43,441
Convenience store: 14,787
Gas or service station: 8,695
Bank: 2,922
The residential environments of the United States and South Korea are different.
The United States certainly has apartments, and I assume their number is substantial.
At the same time, there are also a considerable number of private houses.
And there are likely to be a significant number of crimes occurring in the alleys and streets of those residential neighborhoods as well.
The fact that, when traveling in the United States, people distinguish between neighborhoods where it is safe to go out at night and those where it is not is not merely a joke.
Considering that, I thought that if we wanted a more detailed figure, we would need data that clearly identifies and separates alleys, streets, sidewalks, and similar public areas from residences.
And in the FBI document mentioned above, Street/highway: 75,329 is clearly listed as the category with the highest number of robberies.
The document specifically states that Street/highway: 75,329 includes:
“Highway/Road/Alley/Street/Sidewalk — open public ways for the passage of vehicles, people, and animals.”
In other words, highways, roads, alleys, streets, and sidewalks are all included as open public ways for the passage of vehicles, people, and animals.
This confirms that the 35,575 robberies classified as Residence are a completely separate figure from those public areas.
This accounts for 15.7% of all robberies.
Now that we have obtained the figure of 15.7%, let’s calculate the figures for New York, California, and Maine, along with the figures for their respective major cities: New York City, Los Angeles, and Portland.
Obviously, it would be unreasonable to assume that the proportion is exactly 15.7% across the entire country.
Once again, please keep in mind that this is an estimated figure for comparison purposes.
| Category | Total Robberies in 2023 | Residential Rate | Residential Robberies Using 15.7% |
|---|---|---|---|
| 🇺🇸 New York State | 21,309 cases | 15.7% | Approx. 3,346 cases |
| 🇺🇸 New York City | 16,902 cases | 15.7% | Approx. 2,654 cases |
| 🇺🇸 California | 49,177 cases | 15.7% | Approx. 7,721 cases |
| 🇺🇸 Los Angeles | 8,696 cases | 15.7% | Approx. 1,365 cases |
| 🇺🇸 Maine | 165 cases | 15.7% | Approx. 26 cases |
| 🇺🇸 Portland, Maine | 27 cases | 15.7% | Approx. 4 cases |
Can you see why I deliberately added Maine and the city of Portland?
South Korea had 110 residential robbery cases, while Seoul had 24 cases.
Wait a minute.
Maine and its largest city, Portland, had 165 and 27 cases, respectively.
You might think:
“Hey, that’s about as safe as South Korea and Seoul.”
| Region | Estimated Residential Robberies Using 15.7% | Cases per 100,000 People | Multiple Compared with South Korea |
|---|---|---|---|
| 🇰🇷 South Korea | 111 cases | 0.217 cases | 1× |
| 🇺🇸 Maine | Approx. 26 cases | Approx. 1.86 cases | Approx. 10.1× |
| 🇺🇸 New York State | Approx. 3,346 cases | Approx. 17.10 cases | Approx. 92.9× |
| 🇺🇸 California | Approx. 7,721 cases | Approx. 19.82 cases | Approx. 107.7× |
However, the total population differs from one sample to another — in other words, from one region to another.
That’s why we need to look at the number of cases per 100,000 people.
Even if both figures are 10 cases, 10 out of 1,000 people is clearly different from 10 out of 10,000 people.
We need to use the same denominator to properly compare the situation.
When we do that, even at the state level, the difference between Maine and South Korea is about 10 times.
Now let’s look at the comparison between the largest cities.
| Region | Estimated Residential Robberies (Residential Robbery × 65.4%) | Cases per 100,000 People | Multiple Compared with Seoul |
|---|---|---|---|
| 🇰🇷 Seoul | Approx. 24 cases | Approx. 0.26 cases | 1× |
| 🇺🇸 Portland, Maine | Approx. 4 cases | Approx. 5.87 cases | Approx. 23× |
| 🇺🇸 New York City | Approx. 2,654 cases | Approx. 31.15 cases | Approx. 122× |
| 🇺🇸 Los Angeles | Approx. 1,365 cases | Approx. 35.65 cases | Approx. 139× |
The difference is surprisingly large.
But we shouldn’t jump to conclusions.
Among these cases, there are also many where the offender originally intended only to commit theft, but unexpectedly encountered the homeowner and the crime turned into robbery.
How do I know that?
| Weapon Type | Percentage |
|---|---|
| No Weapon — Strong-arm | 44.2% |
| Firearm | 35.9% |
| Knife or Cutting Instrument | 8.4% |
| Other Dangerous Weapon | 11.5% |
| Total | 100.0% |
These are the weapon percentages among all robbery cases in the same year.
Remarkably, 44.2% involved no weapon at all — classified as “strong-arm.”
If the offender had clearly planned from the beginning to confront the homeowner and take their property, it would be difficult to imagine so many cases involving nothing but bare hands.
No matter how strong my punches might be.
Because this is the United States, a homeowner could potentially come out carrying a shotgun after hearing a noise in the house.
If someone deliberately planned to use no weapon from the beginning — meaning they had considered the possibility of confronting a homeowner armed with a shotgun and still chose to go in unarmed — and their plan afterward was simply:
Run away immediately,
or
Raise both hands, lie flat on the ground, and beg for mercy,
then I’m not sure what kind of threat we should consider that to be.
In other words, when we’re talking about personal safety, it is clear that the 44.2% strong-arm figure is a very ambiguous number.
Americans could also reasonably say:
“Take the firearms out of your table and then make the comparison.
South Korea doesn’t have widespread civilian access to firearms, after all.
So compare the cases where no firearm was involved.”
If we do that, then that 100-times figure…
| Category | Number of Cases | Cases per 100,000 People | Compared with South Korea |
|---|---|---|---|
| 🇰🇷 South Korea | 110 cases | 0.213 cases | 1× |
| 🇺🇸 United States — Total | Approx. 22,804 cases | Approx. 6.81 cases | Approx. 32.0× |
35,575 U.S. residential robbery cases × (100% − firearm rate of 35.9%)
= 22,804 cases, approximately 32 times higher
You can immediately see how much the figure drops.
Someone could also ask us to account for the differences in residential environments between the two countries.
If we did that, the 100-times figure would become a completely meaningless comparison.
Because the residential environments in the two countries are fundamentally different.
| Category | Percentage |
|---|---|
| Fewer than 10 Units + Mobile Homes | Approx. 85.0% |
| 10 Units or More | Approx. 14.9% |
| Other | Approx. 0.1% |
| Total | 100% |
In the United States, multi-unit residential buildings with 10 or more units—roughly comparable to apartment buildings and larger multi-family buildings in South Korea—account for only about 15% of all housing units.
Conversely,
South Korea
| Housing Type | Number of Housing Units | Total Share |
|---|---|---|
| Single-Family Houses | 3.861 million units | 19.8% |
| Apartments | 12.632 million units | 64.6% |
| Row Houses | 539,000 units | 2.8% |
| Multi-Family Houses (Villas) | 2.303 million units | 11.8% |
| Housing Units in Non-Residential Buildings | 212,000 units | 1.1% |
| Total | 19.546 million units | 100% |
The proportion of single-family houses is approximately 20%, which is almost the exact opposite.
I hope you don’t ask, “Why are you suddenly comparing residential structures?”
These days, apartments have become so common in South Korea, and the country is so safe, that people may no longer remember the advantages apartments once had.
At one time, one of the advantages of living in an apartment was:
“You don’t have to worry about burglars breaking in.”
You had to get past the security office, the entrances and hallways were covered by CCTV, and there were residents everywhere watching what was going on.
These days, if you don’t have a resident-only access code,
you can’t even get inside.
Let’s continue.
Your head is probably already starting to hurt, right?
That’s why, instead of trying to account for every single variable, subtract everything that needs to be excluded, and then compare the adjusted figures again—which we’ll deal with another time—
I decided to keep things simple and just add the figures together.
If, as the title of this article suggests, we want to discuss how safe I am inside my own residence, what figures should we add together?
I think we should add burglary to residential robbery.
Why?
Because both burglary and residential robbery involve someone breaking into my residence in order to take property.
Now imagine that you encounter someone who entered your home intending only to commit burglary.
How do you think that situation is going to unfold?
Imagine a situation like this in the United States:
“I’ve got a shotgun, and you’ve got two fists. What’s up?”
If that happened in South Korea, however, you’d already be committing a crime yourself:
illegal possession of a weapon.
So what happens when you, unarmed, encounter a burglar?
Do you think the burglar will say:
“Oh? I thought nobody was home. I came here to steal something, but I see someone is here…
Have a nice day.”
and simply walk out?
Probably not.
From that moment, there is a possibility that one more unarmed robbery has just been created.
The best possible outcome in this terrible situation is that the burglar runs away.
Remember this:
Once a burglar has been discovered, whether they run away is not something you get to choose.
Therefore, I believe that the mere fact that someone has broken into your residence is itself relevant to your personal safety.
And because burglary accounts for the overwhelming majority of these incidents, it is something we cannot simply leave out.
For that reason, I combined burglary and residential robbery and ran the comparison again.
This produced a more understandable multiple for comparison.
| Region | Estimated Residential Burglaries (54.5% Applied)(Excluding Seoul) | Cases per 100,000 People | Multiple Compared with South Korea |
|---|---|---|---|
| 🇰🇷 South Korea | Approx. 6,315 cases | Approx. 12.21 cases | 1× |
| 🇺🇸 Maine | Approx. 709 cases | Approx. 50.80 cases | Approx. 4.2× |
| 🇺🇸 New York State | Approx. 11,707 cases | Approx. 59.82 cases | Approx. 4.9× |
| 🇺🇸 California | Approx. 55,955 cases | Approx. 143.60 cases | Approx. 11.8× |
This table will be used in the Theft section, but I have included it here for clarity.
Once we move on to burglary, the numbers rise into the tens of thousands and even the hundreds of thousands, making them incomparable to the few thousand robbery cases.
When discussing personal safety, we cannot ignore the possibility of you encountering a burglar among all those incidents.
The combined figure for residential burglary and residential robbery is…
| Region | Residential Robbery + Residential Burglary | Cases per 100,000 People | Multiple Compared with South Korea |
|---|---|---|---|
| 🇰🇷 South Korea | Approx. 6,426 cases | Approx. 12.43 cases | 1× |
| 🇺🇸 Maine | Approx. 735 cases | Approx. 52.66 cases | Approx. 4.2× |
| 🇺🇸 New York State | Approx. 15,053 cases | Approx. 76.92 cases | Approx. 6.2× |
| 🇺🇸 California | Approx. 63,676 cases | Approx. 163.42 cases | Approx. 13.2× |
This is the result.
Now we can see that the difference has changed to a multiple that is much easier to understand.
Even the roughly 10-fold difference mentioned earlier should, in my view, be reduced further because there are so many differences between the two countries.
These include the differences in residential environments mentioned earlier, as well as the fact that the vast size of the United States can mean that police may take relatively longer to arrive, which offenders may take advantage of.
There are really many differences to consider.
For that reason, I don’t think we should simply look at the difference in multiples and conclude that Americans steal more.
Even without excluding all of the many factors I have mentioned,
if we simply compare the larger figures as they are,
Maine is only about four times higher.
Even though firearms are present.
Now let’s look at Japan, which is much more similar to South Korea in many respects.
| Region | Total Residential Robberies | Residential-Targeted Robberies | Residential Share |
|---|---|---|---|
| 🇯🇵 Japan — Nationwide | 414 cases | 152 cases | 36.7% |
| 🇯🇵 Tokyo | 70 cases | 24 cases | 34.3% |
Japan’s Metropolitan Police Department transparently publishes the proportion of residential robberies in its statistics, so there was no need to calculate a separate percentage or use an estimated figure.
Some of you may wonder whether the category labeled “residences” refers only to detached houses and therefore excludes apartments.
Although that is how the category is labeled, you can consider it to be the same type of category as the “residential” classification used in the South Korean data.
| Region | Residential-Targeted Robberies | Cases per 100,000 People | Multiple Compared with South Korea / Seoul |
|---|---|---|---|
| 🇰🇷 South Korea | 111 cases | Approx. 0.217 cases | 1× |
| 🇯🇵 Japan — Nationwide | 152 cases | Approx. 0.122 cases | Approx. 0.56× |
| 🇰🇷 Seoul | 24 cases | Approx. 0.26 cases | 1× |
| 🇯🇵 Tokyo | 24 cases | Approx. 0.170 cases | Approx. 0.65× |
Japan, as expected?
It’s even lower.
“You used the higher figure earlier—the one based on 98 cases. What about the difference?”
Yes. Even then, Japan is still lower.
| Region | Residential-Targeted Burglary | Cases per 100,000 People | Comparison |
|---|---|---|---|
| 🇰🇷 South Korea | Approx. 5,693 cases | Approx. 11.00 cases | 1× |
| 🇯🇵 Japan — Nationwide | 17,469 cases | Approx. 14.05 cases | Approx. 1.28× |
| 🇰🇷 Seoul | Approx. 1,064 cases | Approx. 11.40 cases | 1× |
| 🇯🇵 Tokyo | 1,375 cases | Approx. 9.75 cases | Approx. 0.86× |
Theft should be covered separately, but let’s take a quick look for fun.
Only Japan’s nationwide total is higher than South Korea’s nationwide total.
Despite the other figures being lower than South Korea’s, the reason this particular figure is higher may be that Japan has a somewhat larger number of developed urban areas compared with South Korea’s concentration around the Seoul–Gyeonggi–Busan metropolitan areas.
Once again, South Korea and Japan are fairly similar when it comes to crime rates.
I didn’t expect them to be this similar.
Thanks to Japan, I can at least feel reassured that the calculations I made earlier were not wildly inaccurate.
So I feel comfortable publishing this article.
I originally wanted to find out whether South Korea is safe, but perhaps after seeing that 110 cases was already such a small number, I felt there wasn’t much more to investigate.
And somehow, I ended up talking about the United States for quite a while.
Still, we got the answer we were looking for.